

Flexible sample import
Upload CSV, TSV or TXT files with automatic FSC-H and SSC-H recognition, including common channel aliases and input quality checks.
03 / LIFE SCIENCE RESEARCH
Flow cytometry research workspace
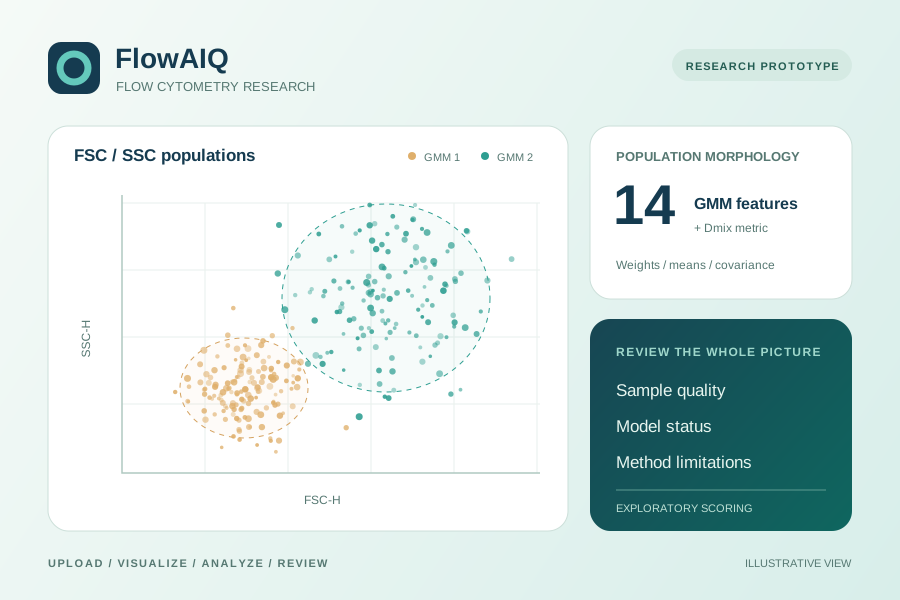
FlowAIQFlowAIQ brings flow cytometry data into one research workspace. Upload a sample, visualize FSC/SSC distributions, extract population morphology features and inspect an exploratory stem cell score alongside model limitations.
CELL MORPHOLOGY / DISTRIBUTION
Compare cells in suspension with illustrative scatter plots and three-dimensional Gaussian density surfaces.
Cells in suspension
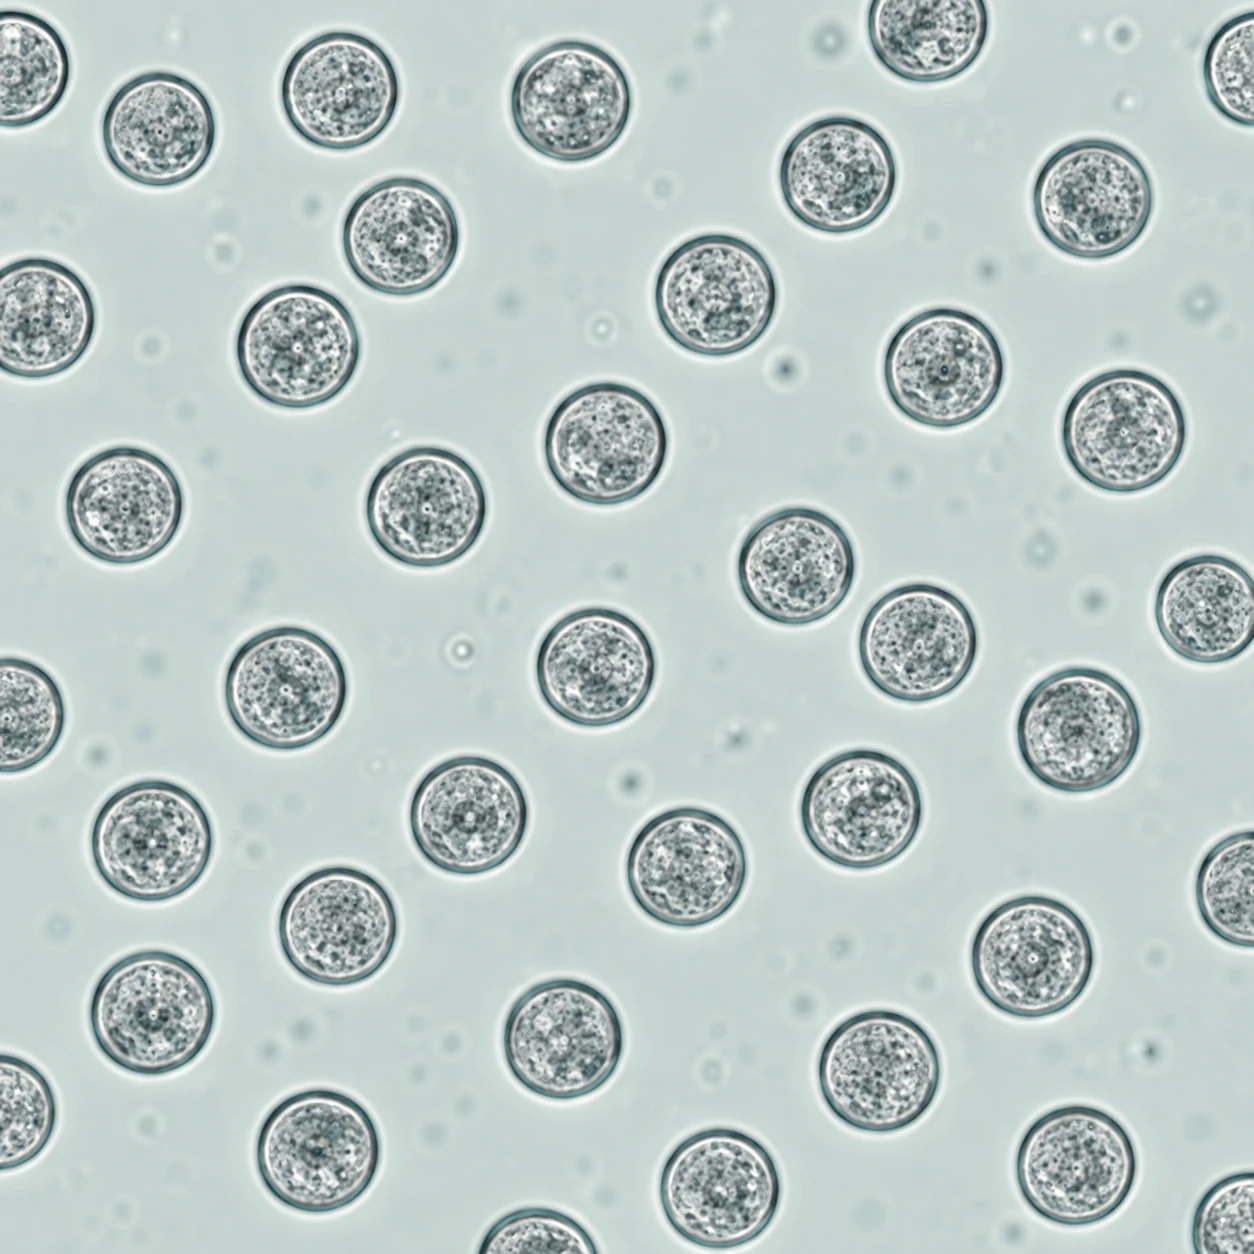
Similarly sized, plump cells with smooth outlines, dispersed individually in suspension.
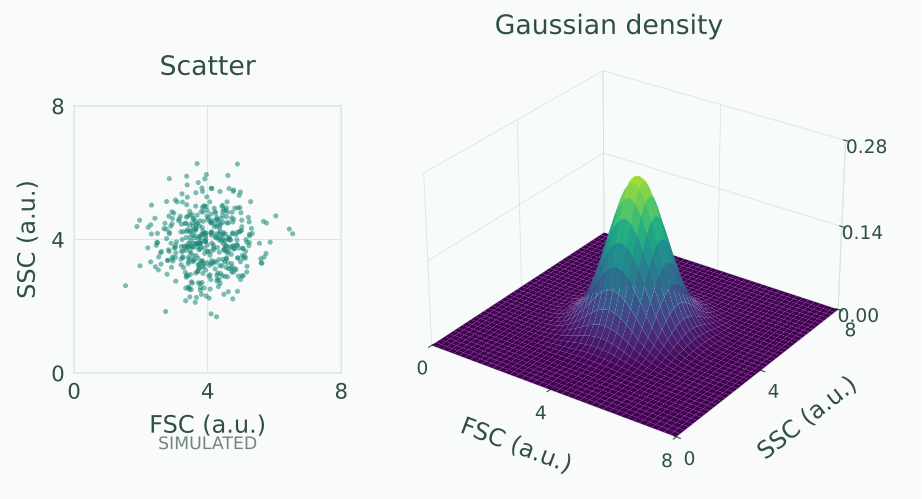
A tight scatter cloud corresponds to a narrow Gaussian with a tall, smoothly rounded peak.
Cells in suspension
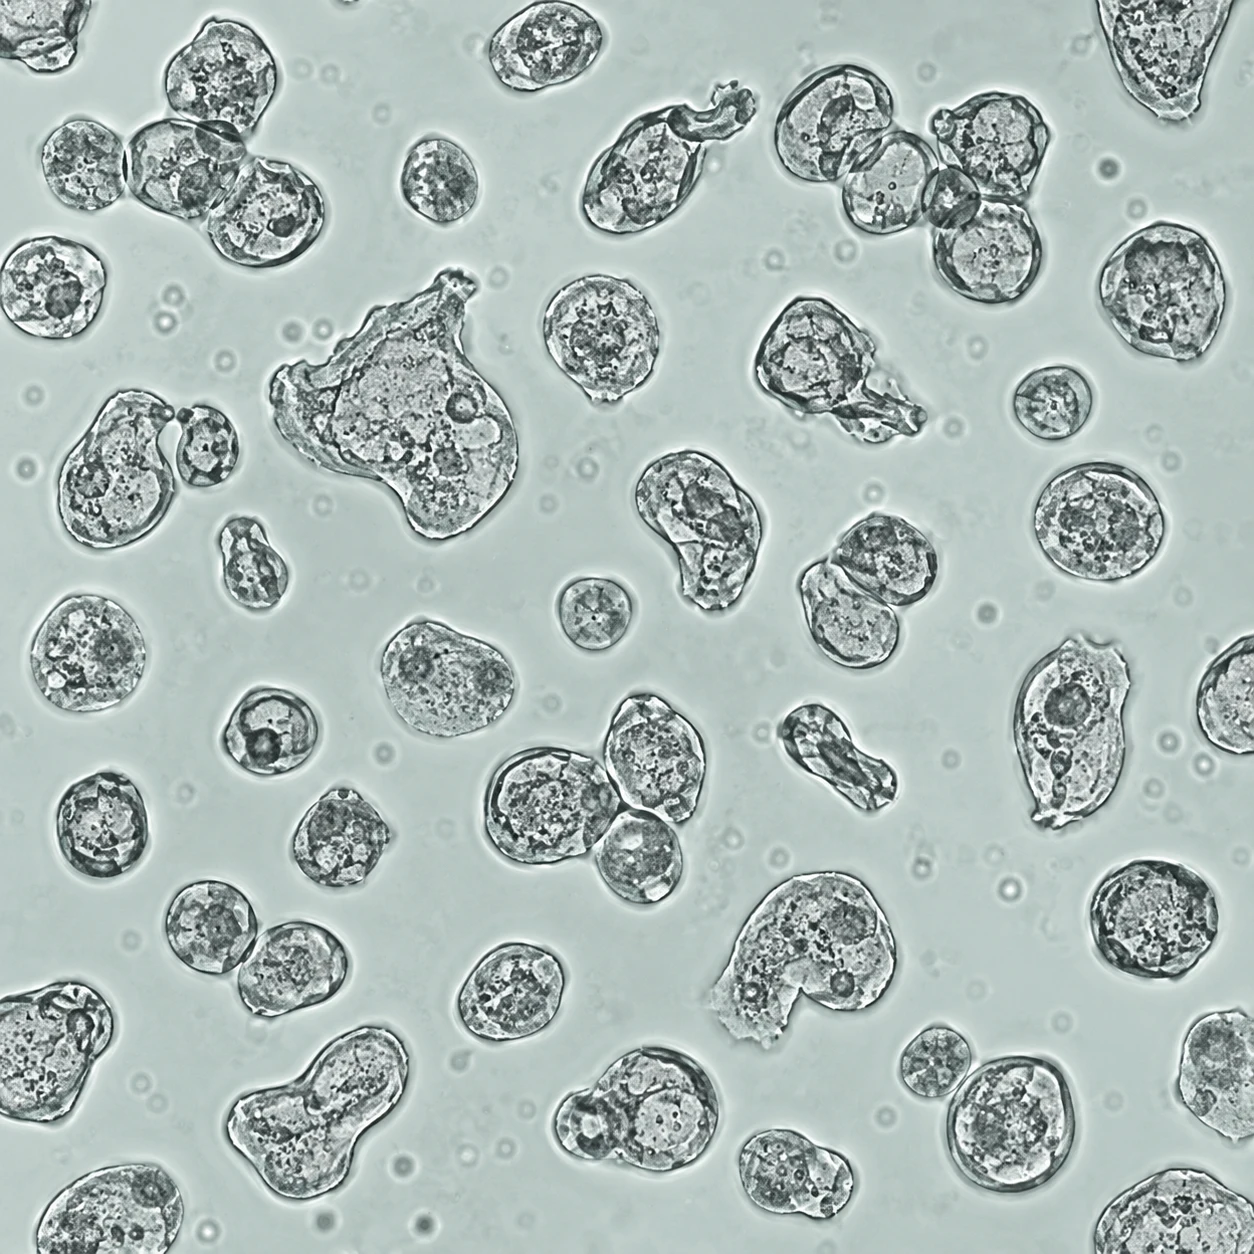
Cells of different sizes, with flattened or indented outlines and some small adherent clusters.
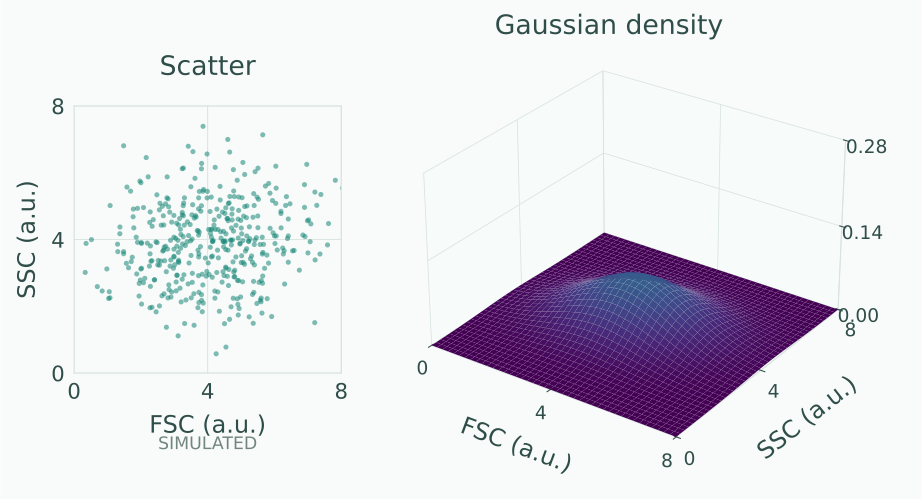
A wider scatter cloud corresponds to a more spread-out Gaussian with a lower, flatter peak.
Conceptual illustration. Cell images are AI-generated; scatter points and density surfaces are simulated with shared axis scales (a.u. = arbitrary units). Morphology and scattering patterns do not have a one-to-one relationship, and these examples do not indicate cell quality or a FlowAIQ score.
PRODUCT / CAPABILITIES
Upload CSV, TSV or TXT files with automatic FSC-H and SSC-H recognition, including common channel aliases and input quality checks.
Explore scatter plots with two Gaussian mixture components shown as distinct populations.
Review 14 GMM parameters describing component weights, means and covariance, together with the Dmix summary metric.
Inspect outputs from a reconstructed model alongside its status and method warnings. Current weights still require independent external validation.
Sign in with an email account, with separate super administrator, administrator and user roles and an account management dashboard.
The default analysis service processes uploads in memory without retaining uploaded files, event points or analysis results. Account and session records are stored separately.
WORKFLOW / RESEARCH
Follow the sample from channel recognition through population modeling to feature and score review. Input quality checks, model status and method warnings stay alongside the results, while a synthetic example lets researchers explore the workflow.
RESEARCH / LIMITATIONS
FlowAIQ is a research prototype. Its current model was reconstructed using 110 samples; it is not the original authors’ model and has not undergone independent external validation. It must not be used for clinical diagnosis, treatment decisions or cell product release.